AM625 has a single R5, base at 0x1d400000 ↔ 0x1d500000
in case of j721E, look at the last of the R5 cluster’s debug base 0x1d510000 → So, we need to account for it 0x1d500000 ↔ 0x1d600000
The other one is the ap_address_offset → it is 0x100
I am trying to confirm max_aps-> 10 should work fine, since we dont refer to any AP > 8… but I will confirm the hardware config later today.
Got it working…
couple of gotchas:
a) minor tweaks on the cfg file needed
b) for some reason, I think if the core is in wfi, I think openocd seems to think the core is powered down in j721e… but, if i put a while(1) at the end as in the video, build the example code with -ggdb, i can use gdb-dashboard easily.
This is the same error I got, so at least it seems I was on the right track. Impressive work!
Since it sounds like you also had to introduce the while loop to make the core appear online, do you know whether there’s any chance this would work without the new firmware but with the while loop? It sounds like you know what’s going on and expect the firmware to be necessary, so I guess probably not.
Error: dmem_emu_ap_q_read EMU AP reg: 0x00000014
Error: dmem_emu_get_ap_reg: R 0x4c7d510314 > 0xd2800000
Error: target->coreid 0 powered down!
I dug a little more into this → looks like coresight status register read seems to be translated by openocd as core powered down… reached out to the debug folks for clarity as to my knowledge, TI had’nt customized ARM or coresight components (could be a integration oversight)…
but anyways, yeah - robert nelson checked out the current firmware with the devmem2 commands out and reported that firewalls are behaving as designed → so no access seem to get through… I will try and push internally here to ship the firmwares out asap - at least the good news is that the new firmwares should work…
Ok, that’s very helpful. I’ll probably plunk down the cash for the debug hardware in the next few days if I don’t hear anything suggesting the new firmware will be available soon.
I decided to try my hand at debugging code on the Cortex-R5 the old fashioned hardware JTAG way… I plunked down the cash and I’m now the proud owner of a shiny new TUMPA Happy to report the heatsink doesn’t interfere at all with the Tag-Connect.
However, I have run into an issue that I am having some trouble getting around. Same error occurs on both Win and Linux hosts Invalid ACK (4) in DAP response.
D:\Users\Frede\Desktop\openocd-v0.12.0-rc1-i686-w64-mingw32\bin>.\openocd.exe -f .\BBAI64.cfg
Open On-Chip Debugger 0.12.0-rc1 (2022-09-18-17:56)
Licensed under GNU GPL v2
For bug reports, read
        http://openocd.org/doc/doxygen/bugs.html
adapter speed: 16000 kHz

Info : Listening on port 6666 for tcl connections
Info : Listening on port 4444 for telnet connections
Info : clock speed 16000 kHz
Info : JTAG tap: j721e.cpu tap/device found: 0x1bb6402f (mfg: 0x017 (Texas Instruments), part: 0xbb64, ver: 0x1)
Error: Invalid ACK (4) in DAP response
versions tested:
Windows 10: openocd-v0.12.0-rc1-i686-w64-mingw32.tar.gz
Debian Bullseye: xPack OpenOCD x86_64 Open On-Chip Debugger 0.11.0+dev (2022-09-01-17:56)
I was thinking it may be due to improper configuration of the TUMPA RST signal polarity select jumper block as it was the only jumper block I couldn’t clearly see in the pictures in the K3 SoC OpenOCD HOWTO.
Any tips to work through this would be greatly appreciated!!
Fred
EDIT:
Figured it out. Didn’t specify the search path.
D:\Users\Frede\Desktop\openocd-v0.12.0-rc1-i686-w64-mingw32\bin> .\openocd.exe -s ..\share\openocd\scripts\ -f .\BBAI64.cfg
Open On-Chip Debugger 0.12.0-rc1 (2022-09-18-17:56)
Licensed under GNU GPL v2
For bug reports, read
        http://openocd.org/doc/doxygen/bugs.html
adapter speed: 16000 kHz

Info : Listening on port 6666 for tcl connections
Info : Listening on port 4444 for telnet connections
Info : clock speed 16000 kHz
Info : JTAG tap: j721e.cpu tap/device found: 0x1bb6402f (mfg: 0x017 (Texas Instruments), part: 0xbb64, ver: 0x1)
Info : starting gdb server for j721e.cpu.sysctrl on 3333
Info : Listening on port 3333 for gdb connections
Info : starting gdb server for j721e.cpu.a72.0 on 3334
Info : Listening on port 3334 for gdb connections
Info : starting gdb server for j721e.cpu.a72.1 on 3335
Info : Listening on port 3335 for gdb connections
Info : starting gdb server for j721e.cpu.mcu_r5.0 on 3336
Info : Listening on port 3336 for gdb connections
Info : starting gdb server for j721e.cpu.mcu_r5.1 on 3337
Info : Listening on port 3337 for gdb connections
Info : starting gdb server for j721e.cpu.main0_r5.0 on 3338
Info : Listening on port 3338 for gdb connections
Info : starting gdb server for j721e.cpu.main0_r5.1 on 3339
Info : Listening on port 3339 for gdb connections
Info : starting gdb server for j721e.cpu.main1_r5.0 on 3340
Info : Listening on port 3340 for gdb connections
Info : starting gdb server for j721e.cpu.main1_r5.1 on 3341
Info : Listening on port 3341 for gdb connections
Sorry for cluttering up Tony’s stellar initial post with all this R5 debugging junk. Maybe all this info will help some other folks out someday…
I recollect starting the core up using the remote proc commands before i attempted to talk to the core… jtag will not be able to switch on the clocks and power to the processor, hence the need to start it up with remoteproc commands.
For your dhrystone branch, I am wondering where you got the files in your r5/ folder? I am trying to code up a Cortex-R5F Whetstone and I’m hoping to use the dpl clock API:
Assuming you’re referring to debugging the R5 cores – it probably works. You’d need the TagConnect probe and depending on which J-Link model you have some variant of adapter for the various connector sizes.
I’ve tried building the dhrystone branch on my Linux desktop, and also on the BBAI64 itself. But either way I see no output in the trace file. Can you tell me, what was the “tweak” you made to the makefile to get it working for you? The main branch (hello world) works as expected.
From the dhrystone branch, adding the “-u _printf_float” didn’t do the trick. But when I copied and pasted your entire makefile into the branch, I am now seeing the dhrystone results in the trace0 file.
Thank you for your help… I’ve been puzzling this one out for a while.
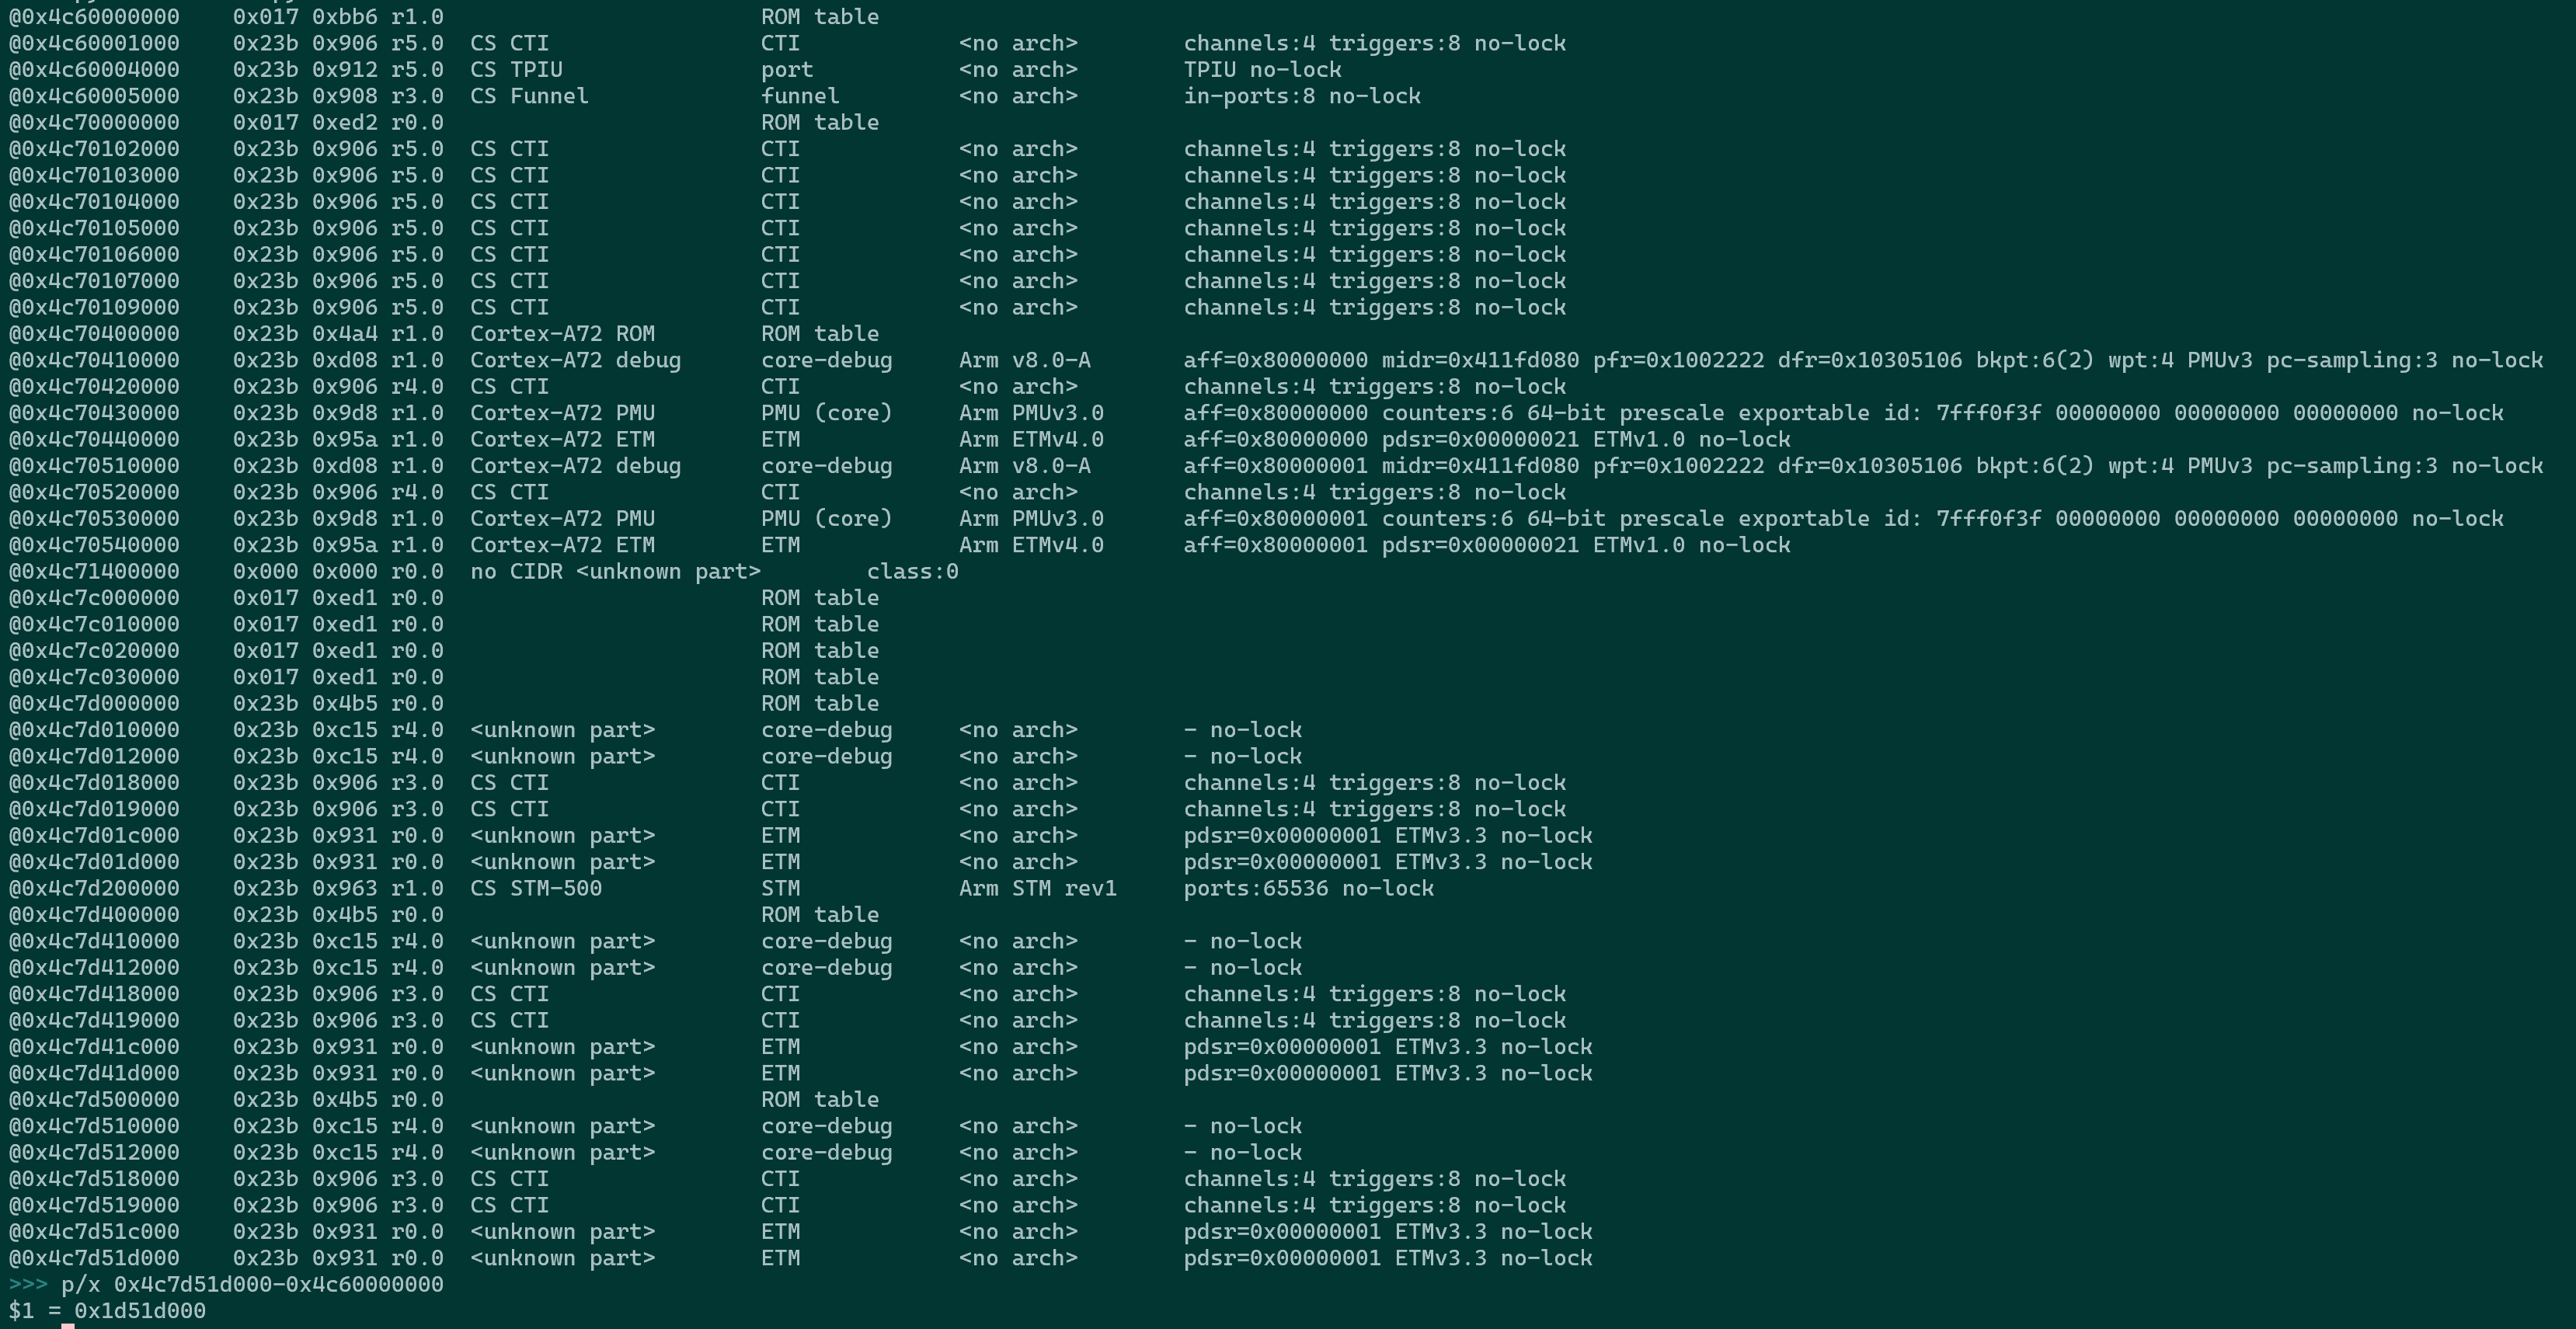
now,i understand the openocd dmem driver, in ti_k3.cfg :
set _dmem_emu_base_address 0x4c60000000
set _dmem_emu_base_address_map_to 0x1d600000
0x4c60000000 is sys bus address for dbg bus
0x1d600000 is the length for cs components
becase last cs component address is 0x1d51d000
so, length is 0x1d600000