Great explanation @kaelinl - this gives me a good foundation for my further experiments (trying - just for the fun of it - to change the remoteproc that its running on). I will update everyone on my findings
Sounds great. I haven’t personally tried that yet and need to do it at some point, so I’d love to hear what you find.
you said “PRU”, but this is code for the R5F cores and not the PRUs. Some similar concept apply but the ISA is very different.
Aren’t R5 cores alternatively called PRUs?can you please elaborate
Hi Barry,
Regarding your first question on the relationship between the GPIO_SET_DATA45 register and PIN 9_14.
Here is how I did it:
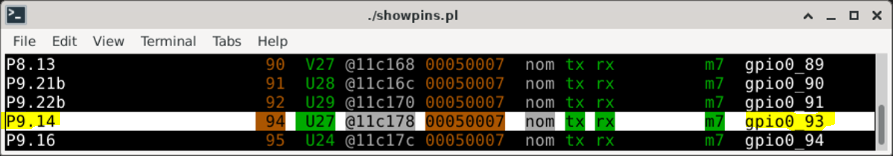
Found that P9_14 is GPIO0_93 using showpins.pl:
Saw Table 12-12 GPIO I/O Signals (continued) in the TRM on page 1383.
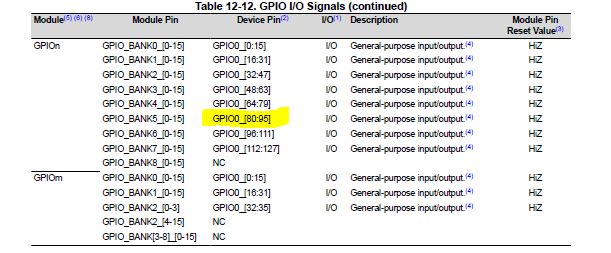
^^^ This is where the ![]() came on!
came on!
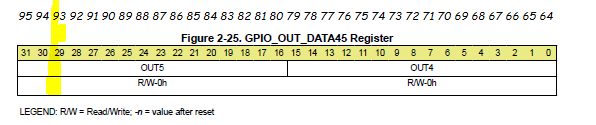
Cross-referencing Figure 2-25 in the TRM J721E_registers4.pdf page 87,
Found that bit 29 was _93.
Doing this GPIO toggle exercise, I realized that for BBAI64 baremetal you have to get all the tech info into your brain and then the linkages of the concepts just kind of filter out of your subconscious. – that is how it seems to work for me anyways.
Looking forward to seeing how you make out with your experimentation. If we get enough brain power on this thing, we will get it figured out ![]() Not sure why the old Beagle veterans haven’t engaged on the AI64… maybe they are just being stealthy
Not sure why the old Beagle veterans haven’t engaged on the AI64… maybe they are just being stealthy ![]()
That’s the issue for me. I’ve been a fan of TI for a long time and a TI component is in nearly every design that I’ve ever done. Their documentation is usually 1st rate. But this time the docs while comprehensive sure seem scattershot.
Very much appreciated! You have now filled in the missing piece for me.
you have to get all the tech info into your brain and then the linkages of the concepts just kind of filter out of your subconscious.
So true, it feels like mental juggling…having to keep 5 things actively in mind even though my buffer can only hold 4…
@CharlieC, I did some digging around and found that the general consensus is that the BBAI64 docs are not as good as they were for the BBB. TI’s CCS even has BBB support. From what I saw while digging around, most of the old beagle veterans are very interested in the PRU-ICSSG support. There is some progress being made on that front but, I am primarily interested in the R5F.
My biggest problem right now is finding good R5F code to study and learn from.
@kaelinl, I see you are making some great progress with your TDA4VM R5F embedded Rust project. Is there any TI sample C code you found that is particularly helpful? From what I saw in the SDK everything is ultra-abstracted and very difficult to follow. Since your rust code is just for the TDA4VM, I can follow it with confidence. Also, a big thanks for your detailed explanation to Barry on the low-level details of the R5F’s memory layout. It really helps my understanding.
EDIT: To clarify, I am specifically looking for R5F code that shows how to use the peripherals on the TDA4VM SoC: Things like, gpio, uart, pwm, counters/timers, SPI, quadrature-encoder interface, etc.
EDIT 2: I have been successfully using the TSC to do timing on R5F Whetstone and Coremark benchmarks I put together. It is slow going doing everything at the register level. I think SPI may be too much for me to get working from just the datasheets. Perhaps, like Kaelin suggested in his first post on this thread, we can get the Linux side to configure stuff and then just use it from the R5F.
Thanks for looking. The BBIA64 is definitely three steps above my last project which used an Intel Edison. The TDA4VM is a code hackers dream and I’m looking forward to learning how to use it.
@benedict.hewson, Have you gotten any gotten any time to work with lower-level aspects of the BBAI64?
I am trying to get motivated to learn about CCS and see what I can do with it. Do you know if we can build anything TD4VM related and run it on the SoC? Can we step into the source using a debugger?
Also, for learning CCS, would you suggest I get a BBB and start with that since it is supported by CCS?
Thanks,
Fred
EDIT: I revisited my CCS install and I don’t see any TDA4VM based boards like the J721EXSOMXEVM in the Getting Started, Browse and Import Examples, Project Wizard, pull-down. Maybe I am missing a crucial step to get the TDA4VM samples loaded??
EDIT2: Just found that Benedict was building TI TD4VM sample code and running it on the R5F cores back in July of '22: AI-64 Running code from R5F cores Seems that you have to build from the command line not from in CCS.
The only thing I’ve done up to this point with CCS and BBAI64 is write PRU code. After much messing around, I was able to get the PRU C/C++ compiler to compile my code and it seems to deploy to the PRU fine. I am still struggling to get an output pin to twitch from the PRU, but I think it’s pin mode stuff I haven’t done yet. I know I can manually go to the GPIO and set the mode from my experience with the BBB. However I’m trying to reorient myself with dtb overlays, rebuild my dto and get those pins configured at startup. I just haven’t done a lot of dtb work so I’m having to figure that out.
But to your point about CCS and BBAI64, if all you are wanting to do is debug application C-code running in Linux (on Cortex A72), you could use CCS or “vanilla” Eclipse CDT to debug using gdbserver running on the BBAI64 and gdb on the PC.
Since I’ve never debugged a Cortex R, I couldn’t say what it takes to single-step code running in them. However my guess is it’ll require the JTAG connection, OpenOCD and all that stuff mentioned in the debugging thread. OpenOCD is listed as a JTAG device in CCS.
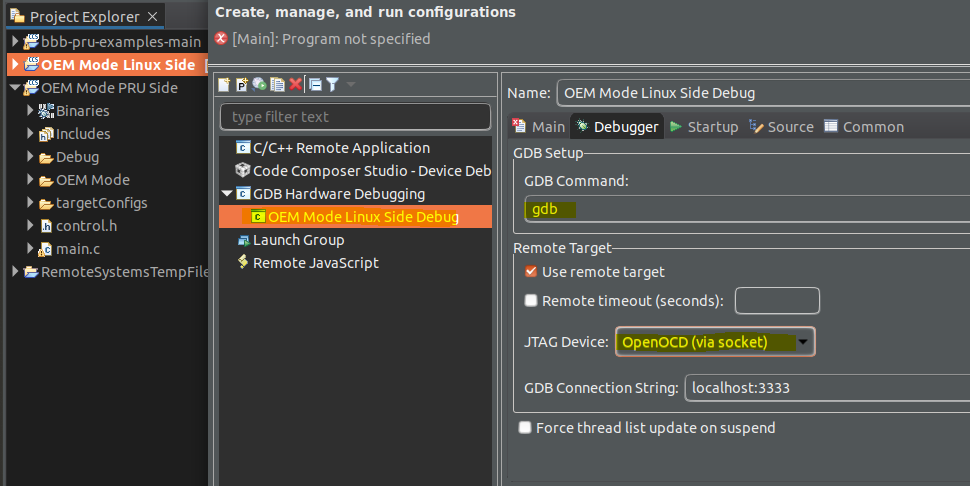
Once OpenOCD is running locally & talking to your JTAG debugging device (the TIAO), then gdb running inside CCS/Eclipse would connect to OpenOCD and start a debugging session. What I have no clue about is the difference in user experience between debugging Linux application code and performing stop-level debugging at the processor level, which is what I’d assume you’d be doing in the Cortex R using the JTAG connection.
Hi Chris,
Thanks for the debugging info. I have been able to single step debug my R5F gpio toggle code using gdb with the TAIO TUMPA. For an IDE experience, I would love to use VSCode with OpenOCD (haven’t looked into that it yet).
For your PRU code, is it something you wrote from scratch or is it something you got from one of TI’s TDA4VM samples? Have you found any TI TDA4VM sample code?
I attempted to get a copy of the Edge AI TDA4VM firmware source code (PSDK-RTOS-AUTO rtos source). My request was declined due to “constrained resources”.
I don’t know if you seen, this git repo from TI yet, as they just recently opened it up. GitHub - TexasInstruments/mcupsdk-core: TI MCU+ SDK core source code repository with drivers, protocol stacks and example applications I think it’s their response to everyone wanting the r5 firmware source code…
Regards,
1 Like
All my PRU code has been from scratch, with starting inspiration from an example project I found on the Internet to know what .h files to include to get certain macros defined for me. But my code is only a step beyond hello world. It’s mostly just been to assert that I can build code, copy it to the BBAI64, and see that the PRU accepts and runs it without throwing errors. It is making reference to the output register to set bits and clear them. But I haven’t actually seen anything turn on and off yet…hence why I think I’ve got a pin mode (mux) issue right now.
And no, I don’t see a way to single-step debug my PRU code from CCS. If there is a way, it’s not obvious.
Someone posted the other day a PRU debugger that I believe you can run from within Linux running on the BBAI64 that will let you do some common debugging things like single-stepping, interrogate register values, set breakpoints, etc. But from what I can tell, it is only accessible within the chip, not to an external IDE like CCS. Add to that, it was written for the PRU_ICSS (and probably works with the PRUSS?) but the PRU_ICSSG subsystem adds a good bit more that wouldn’t be covered such as the broadside memory, configuration registers, and RAT. At least it is something. And after all, PRU code really needs to be as light and minimal as possible to do the real-time job necessary. So I guess the lack of debugging facilities, in a round-about way, enforces this?
But I also saw the limitations of only having 2 PRUs, both of which are also your access to their respective GPIOs. So I’m quite happy to see each PRU_ICSSG gives you essentially 4 MORE threads of execution that can be done without blocking the logic directly monitoring/managing your I/O. This way you can be simultaneously servicing those I/O pins while an RTU/TX_PRU is communicating with the ARM(s) or processing on background tasks or fetching data from DDR. That seems quite valuable.
Yeah, I’ve been using TI’s firmware samples. A few months ago I downloaded the latest one available (technically, the one for some adjacent product, since it was more recent than the J721e one and seemed close enough). It involved filling out some export control nonsense and using a .edu email address, as I recall. I don’t immediately see it from a search, but it looks to be entirely the same files as what are in the repo Robert linked to so I’ll use that one going forward. I wasn’t aware of that new repo so thanks @RobertCNelson for pointing us to it.
The relevant core config/boot code is in nortos sub-directories. The device driver code seems to be generic and is also available, I’ve taken a look at the UART logic and it seems reasonable but haven’t implemented it myself.
@FredEckert - Do you know of way to measure elapsed time of code blocks in Cortex R5?
I’d like to do something like (pseudo-code):
start = get_time()
… run some code…
end = get_time()
elapsed = end-start
I found an article on measuring time on M cores but the supplied code didn’t seem to work (https://embeddedcomputing.com/technology/processing/measuring-code-execution-time-on-arm-cortex-m-mcus)
Hi Barry,
Tony Kao’s minimal Cortex-R5 example’s dhrystone branch shows how to do this using the TI sdk:
#include "r5/kernel/dpl/CycleCounterP.h"
/**
 * \defgroup KERNEL_DPL_CYCLE_COUNTER APIs for Counting CPU Cycles
 * \ingroup KERNEL_DPL
 *
 * For more details and example usage, see \ref KERNEL_DPL_CYCLE_COUNTER_PAGE
 *
 * @{
 */
I found that this was very good for measuring code with short runtimes but would wrap the 32-bit counter when timing longer running code.
For whetstone and coremark, i needed a timer that could time longer running code. I started to explore using the TI sdk dpl clock API:
#include "r5/kernel/dpl/ClockP.h"
/**
 * \defgroup KERNEL_DPL_CLOCK APIs for Clock
 * \ingroup KERNEL_DPL
 *
 * For more details and example usage, see \ref KERNEL_DPL_CLOCK_PAGE
 *
 * @{
 */
I found that this had a lot of dependencies that I didn’t understand and didn’t have time to learn about so I looked for an alternate solution.
That is when i found the GTC:
TRM:
12.10.1 Global Timebase Counter (GTC)
12.10.1.1 GTC Overview
The GTC module provides a continuous running counter that can be used for time synchronization and debug trace time stamping.
Here is what I came up with:
#define GTC_HZ  200000000
double dtime(void)
{
        double q;
        uint64_t t;
        t = (*((uint64_t volatile *)(0x00A90008)));
        q = (double) t / (double) GTC_HZ;
        //printf("ticks=%s dtime=%lf\n", uint64ToDecimal(t), q);
        return q;
}
This came from Roy Longbottom’s whets.c.
The GTC is pretty amazing:
- 64-bit up counter
- No rollover during the lifetime of the device
It is fun working with 64-bit stuff ![]()
Hope this helps.
Fred
This is excellent @FredEckert! Much appreciated.
Can you help me sanity check something? I’m working on moving the example you provided to different pins but have hit a snag. (I realize your example is just a proof-of-concept / test).
In your example, you have
//configure GPIO0_93 pin 9_14 as output
*pDir =  0xDFFFFFFF;
this sets the pin direction for pin 29 as 1 (I guess this register works essentially like a mask)
However, on a freshly booted machine, register 0x00600060 is set to 0x7FFBFFFF, so it seems like setting it to 0xDFFFFFFF is clobbering some bits? (being set to 0x7FFBFFFF implies bits 18 and 31 are already masked, so setting to 0xDFFFFFFF sets pin 29, but turns off 19 and 31)
Perhaps it should be doing an XOR? Something like?
*pDir =^ 0x20000000;
This results in the register being set to 0x5FFBFFFF, in which pins 18, 29, and 31 are masked.
Does this sound logical? I ask because I’m still not 100% confident in how some of this works and I’m not a programmer…only a hacker of things.
I see the same initial state of 0x7FFBFFFF on 0x00600060 on my freshly booted machine. To understand that we would have to dig deeper into it.
Your XOR approach totally sounds logical. Did you try it?
The datasheet says that the reset set is 0xffffffff (all input) which is fairly satndard for most gpio pins. That fact that some have been configured as output would suggest those pins are being used somewhere and eityher u-boot or the kernel has set them as output.
Probably what you should do is
*pDIR = *pDir & (~ (1<<29));
Or perhaps as it should have been
*pDir &= 0xDFFFFFFF;