Prior to my experiences with Beaglebones and embedded Linux, my embedded experience has been with single-core microcontrollers (uCs) running RTOSs and JTAG stop-level debugging using special hardware like the E10A for Hitachi processors or the BDI2000/3000 for PPCs.
My embedded experience relative to this has been on the BBW and BBB, and then the products I develop for that also use the AM3352/8. However in that uC, I’ve only used the one Cortex A8 core and then only debugging applications in Linux via GDB server for C applications. I, personally, never was on a project where I had to develop kernel module drivers and thus needed a Lauderbach or kgdb/kdb for single step debugging those, but we did have those expertise in house for the few drivers we’ve had to write.
But even when doing more advanced debugging, we often developed a lot of the code on BBBs where there was a USB-exposed JTAG debugger built onto the board for doing things like this.
However now that I’m working with a BBAI64, I realize this is my first foray into development on a microcontroller (uC) with multiple cores. So do similar built-in debugging options exist or is additional hardware required?
One of the other threads I’ve read here recently make reference to mikroBUS. And I see a black caged connector next to the Ethernet port that is silk-screened as mikroBUS. This was the 1st I’d even heard of this and I had to google-search it just to be confident “mikroBUS” wasn’t a misspelling.
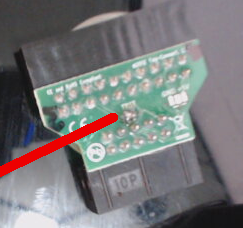
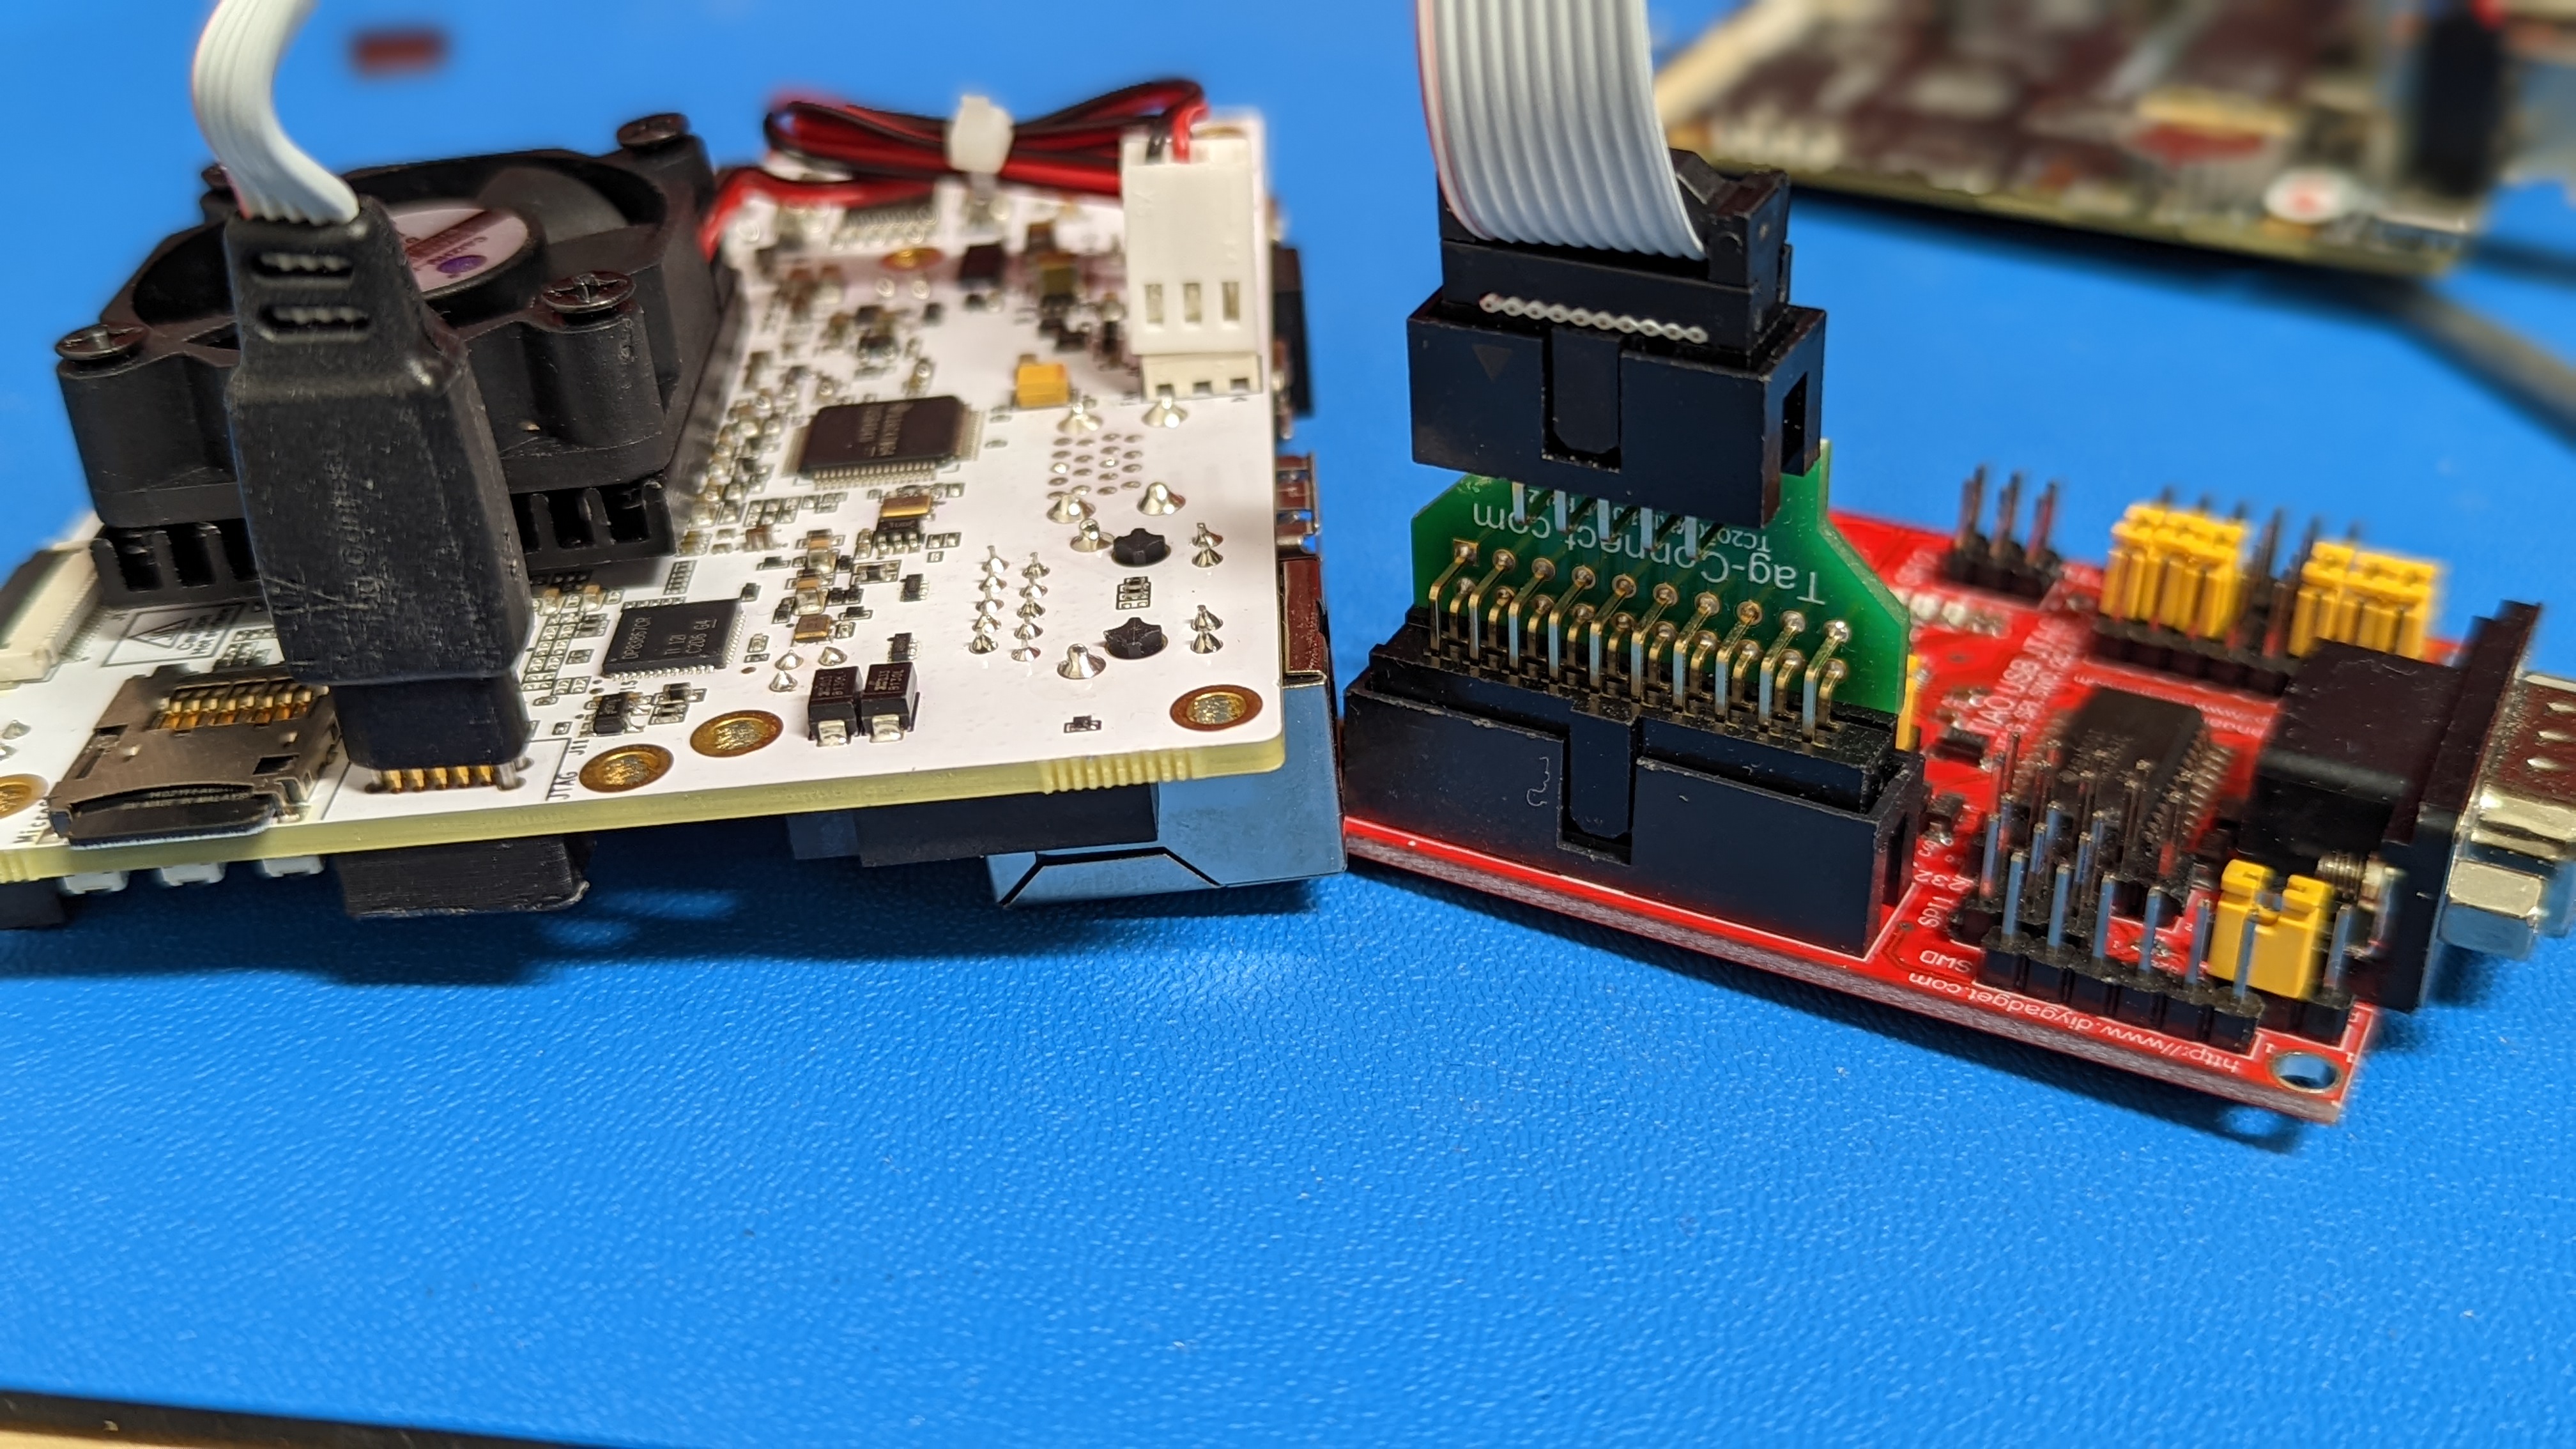
I also see a familiar TAG-Connect pad that is labelled JTAG/J11.
The presence of both of these ports leads me to believe that there isn’t hardware built onto the board for hardware debugging…or if there is, there’s limitations and caveats that demanded the presence of these additional ports.
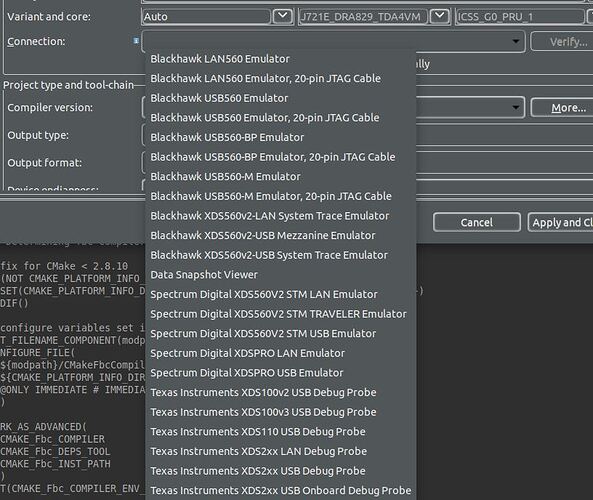
So then I go into CCS and I see a long-list of debugging hardware listed:
Note this may just be for the PRU since that’s the core I have selected.
Just looking at the names, some can be eliminated as options just because they are listed as 20-pin, but that TAG-Connect pad only has 10-pins. Others can be assumed to be either USB or LAN based. But that’s still quite a list. So…
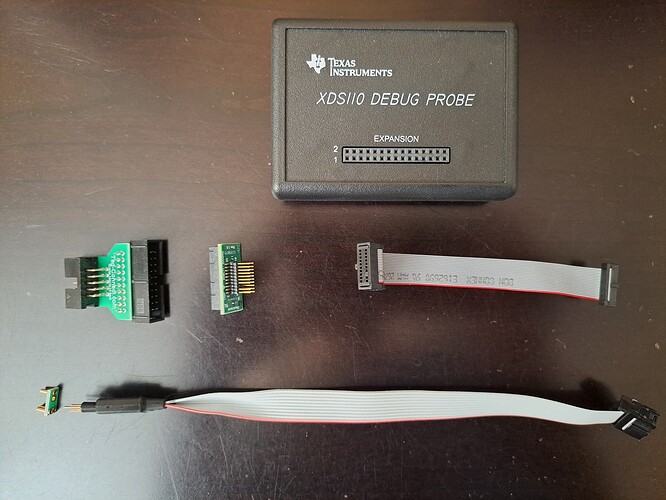
Which of these are best/intended/expected to be used with the BBAI64 (when doing Cortex-R or PRU development)?
And other than connectivity differences such as LAN vs USB, what are the pros and cons as to why you’d choose one over the other?
And if you use one of these, where did you get it (and for how much)?
Note for code running in the Cortex A72s, I don’t expect to need this. I believe I can continue to do what I’m most familiar with which is debug code running in Linux using typical Linuxy solutions. However when debugging code running on the Cortex R5s or PRUs, these options, I’m guessing, are going to require a traditional JTAG connection.
And IF there’s a hardware debugger included on the BBAI64, what are its capabilities and limitations that compelled the BBAI64 developers to include a JTAG port?
As you can see with all the questions, I’m hoping this thread can be an open ended “what do you use, why, and how happy are you with it” kind of discussion, and less of a “here’s your answer”
Also note, for my immediate purposes, I’m mainly only focused on the A72s and PRUs, with the possibility of messing with the Cortex Rs, if anything to get the MCU R5s to kick-off the PRUs before the A72s have completely booted (I’m hoping that’s possible, still haven’t gotten a clear answer as to whether it is or not).
However I’d love to hear from people that are also using a debugger to develop on the other various hardware offerings such as the C6x/7x DSPs, GPU, and Accelerators.


